Investigating The Calculus Sequence With GeoGebra
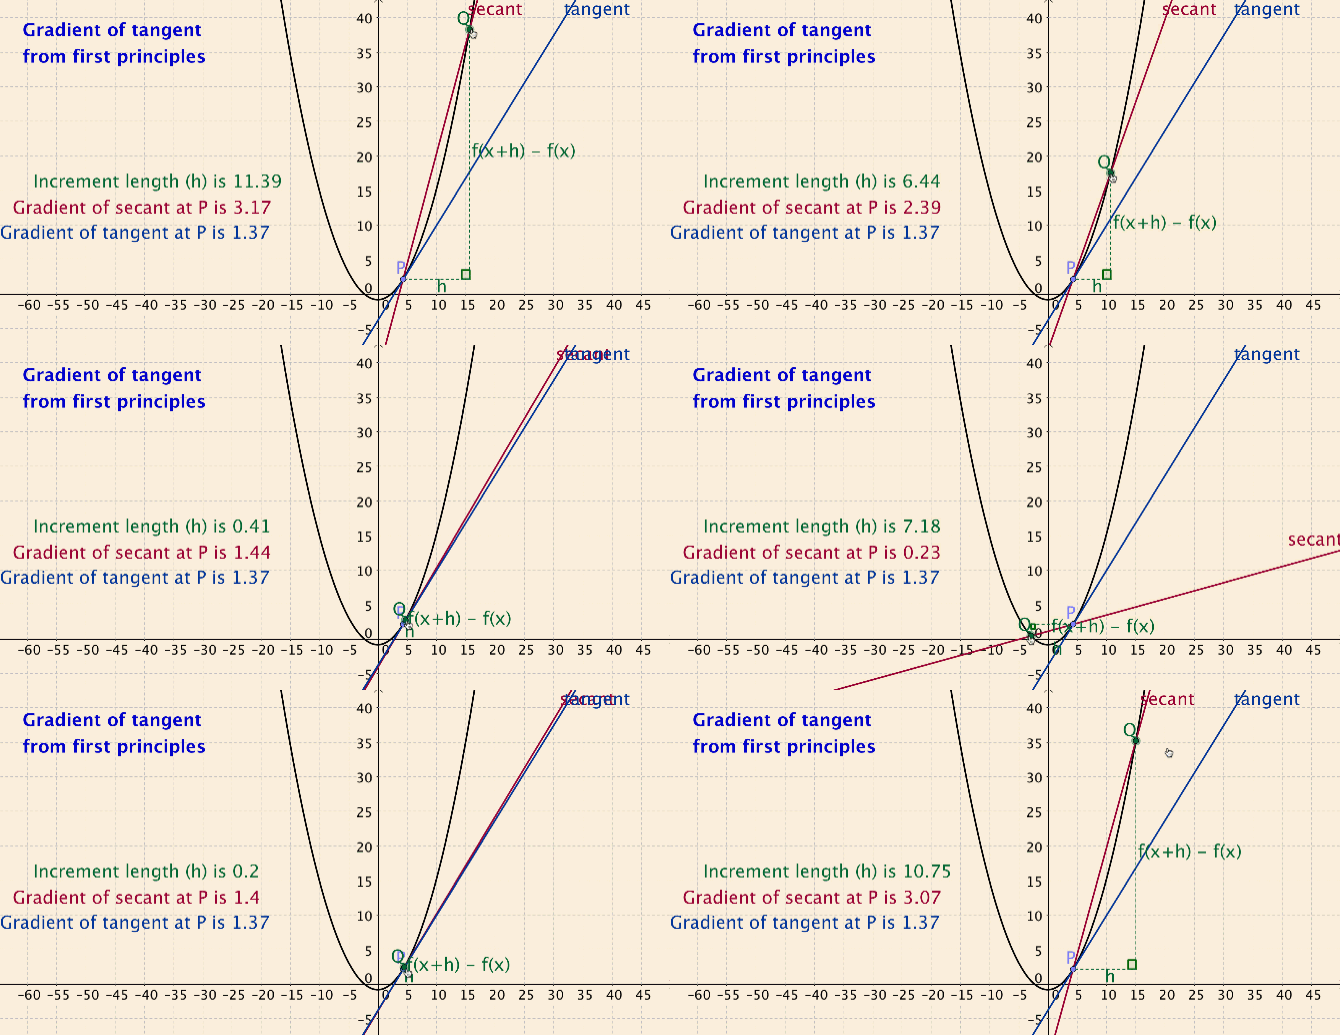
(The original GeoGebra file used for the dynamic image above was created by Annette Taylor, NSW, course participant, August 2009)
GeoGebra brings increased conceptual understandingMost of the GeoGebra-based articles on this site relate to the use of GeoGebra for junior high school levels of mathematics. This is deliberate. GeoGebra is a very powerful tool and it especially captures the imagination of teachers of senior school and university mathematics - for calculus, complex numbers, vectors and the like. In other words, the vast majority of articles and files freely available on the net are centered around these advanced math topics.
I think this is the main reason why teachers whose main domain is upper primary and lower high school tend to view GeoGebra as a tool inappropriate for their purposes. It is for this reason that one intent of this site is to drive home the message that GeoGebra is a brilliant and essential tool not only for higher mathematics but EQUALLY for junior mathematics - the level of mathematics where we 'lose' so many of our students. Moreover, most math teachers are aware that GeoGebra is ideal for demonstrating the principles of geometry and number plane graphs. |
What is less widely known is that GeoGebra is an ideal tool for shining a light on the concepts underpinning fractions and proportion, statistics, trigonometry, Pythagoras’ theorem, all measurement formulas, the derivation of pi and more.
This article is a step away from the other GeoGebra articles because its focus is the use of GeoGebra for teaching calculus.
Below is a re-post of an article by Kathy Tomlinson. What I find powerful throughout Kathy’s article is the strong push to have students inquire, explore, question and discover. This approach, therefore, goes well beyond the (powerfully effective) plug-in-the-data-projector-and-show-the-file method mentioned above. It is clear Kathy strives to allow students to operate as mathematicians.
The original article follows:
‘Using GeoGebra to enhance conceptual understanding in the calculus sequence’
The combination of dynamic capability and ease-of-use make GeoGebra an ideal software to support conceptual learning in the calculus sequence. In this paper, I will discuss GeoGebra activities that I use with Calculus I and II students to learn basic calculus ideas with deep understanding. I have used GeoGebra activities to help students learn many topics including the limit definition of the derivative; the fundamental theorem of calculus; the sequence of partial sums concept; ideas relating to approximate integration; and connecting polar graphs to auxiliary Cartesian graphs. The value of these activities is to help students go beyond understanding how calculus works, to developing intuition about why calculus works.
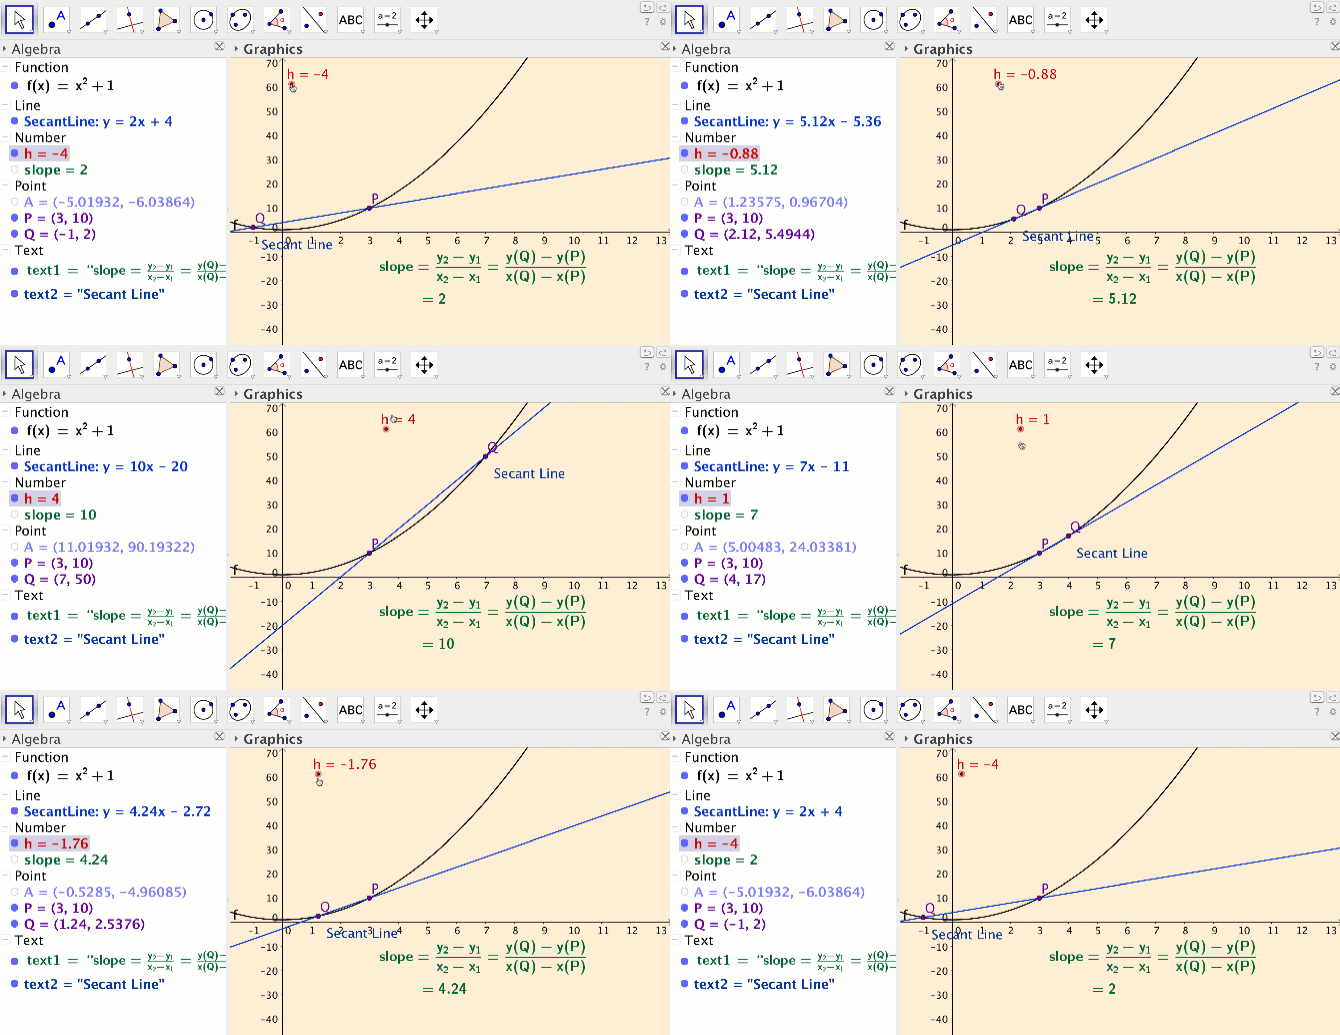
In the activity I developed for the limit definition of the derivative concept, students create their own applets at home by following six short podcasts. In their applets, students create sliders, use the siders to draw dynamic secant lines, and compute the slope of their secant lines (see Figure 1).
In the activity I developed for the limit definition of the derivative concept, students create their own applets at home by following six short podcasts. In their applets, students create sliders, use the siders to draw dynamic secant lines, and compute the slope of their secant lines (see Figure 1).
Figure 1
Students take ownership of knowledge by creating their own applet and assigning colors of their choice. In class, students work out how use their applet for a variety of functions and points on the functions to compute slope of secant line and slope of tangent line. The dynamic aspect of the secant lines allows students to explore connections between the secant line concept, the average rate of change concept, the tangent line concept and the instantaneous rate of change concept. In the end students have developed the limit definition of the derivative, at a very concrete level.
When teaching the Fundamental Theorem of Calculus, I have discovered that it is very easy to get students to respond correctly to a question like:
However, more probing of student understanding demonstrates that students are often simply responding to the cue “find the prime of a long tall s” with the rule “replace t by x.” They aren’t necessarily understanding what is meant by an accumulation function, or that slope and area are inverse operations.
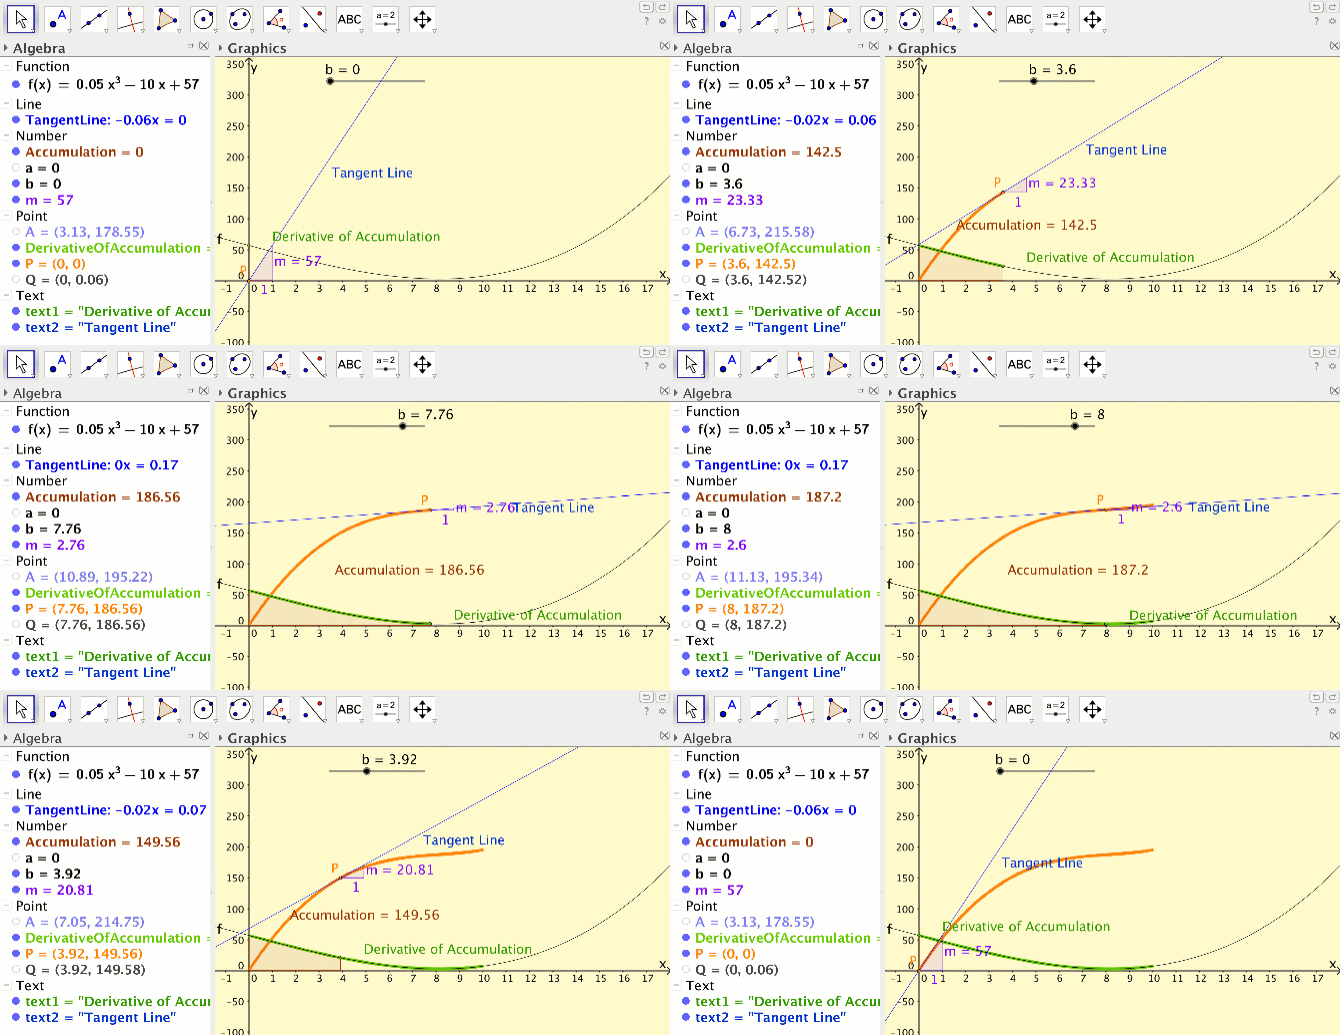
I developed a GeoGebra activity in an attempt to help students gain this understanding. Students follow a series of podcasts to create their own applet at home. Students use the “Integral” command to create a point on an accumulation function, and then use the “Trace” feature to create the accumulation function (see Figure 2). Next, students create an approximate tangent line to the accumulation function, use the “Slope” command to compute its slope and hence the derivative of the accumulation function.
I developed a GeoGebra activity in an attempt to help students gain this understanding. Students follow a series of podcasts to create their own applet at home. Students use the “Integral” command to create a point on an accumulation function, and then use the “Trace” feature to create the accumulation function (see Figure 2). Next, students create an approximate tangent line to the accumulation function, use the “Slope” command to compute its slope and hence the derivative of the accumulation function.
Figure 2
Finally, students create a point on the derivative of the accumulation function and use the ”Trace” feature to create the derivative of the accumulation function. In class, students make conjectures about the relationship between the original function and the derivative of the accumulation function. They explore what happens when they change the original function or the lower endpoint of the integral in their accumulation function. Eventually, students discover that independent of their function or their lower endpoint, the derivative of the accumulation function is equal to the original function, thus discovering the statement of the fundamental theorem of calculus, in a very concrete way.
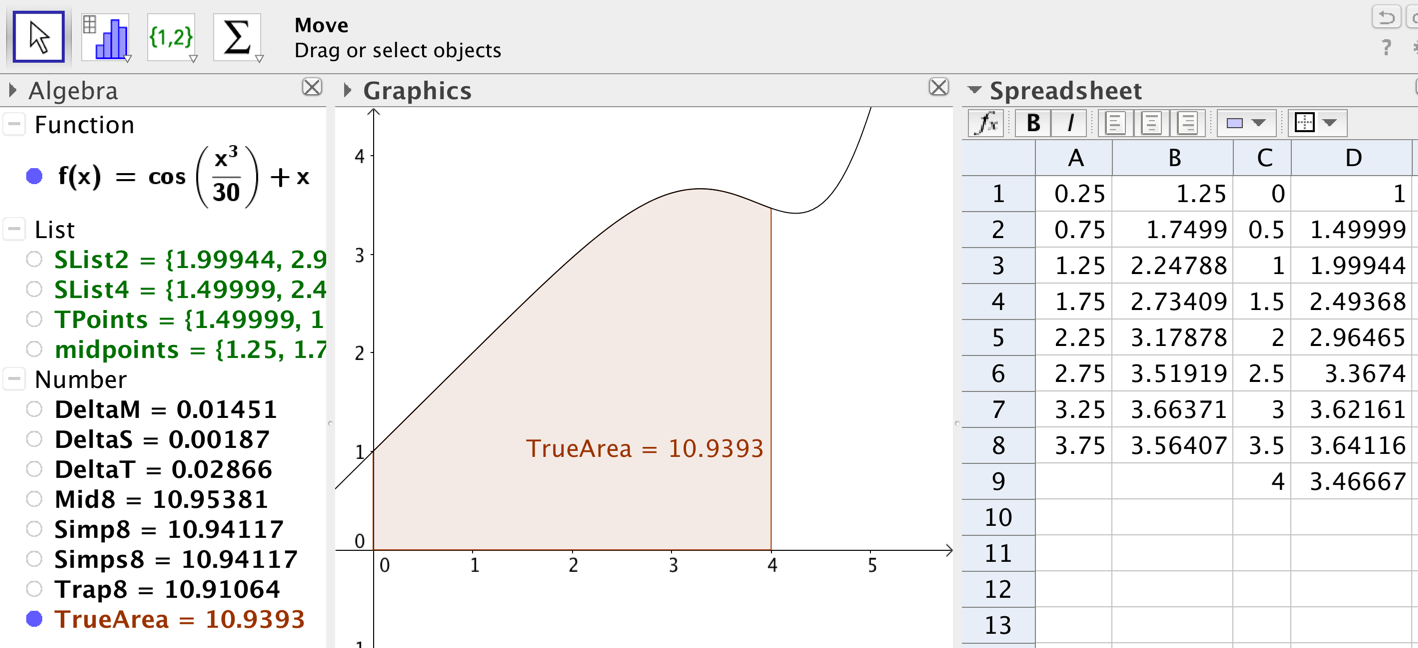
Rather than simply having students learn to compute approximate integrals with the Midpoint Rule, Trapezoid Rule and Simpson’s Rule, I work to help them understand why they are getting their answers. Students bring laptops to class and use the spreadsheet in GeoGebra to compute the approximations and then they compare answers to the “true” value of the integral that GeoGebra computes with the “Integral” command ( see Figure 3). We connect the meaning of the “true” value of the integral to the area concept and discuss how this “true” value may itself be an approximation. GeoGebra’s dynamical capability allows students to change their function and compare approximations easily.
Figure 3
So by exploring different functions, students create conjectures about when to expect an overestimate, when to expect an underestimate and when to expect an exact value. This leads into discussion about the theory underlying each of the approximations and proofs of their conjectures. For example, students conjecture that Simpson’s Rule will always give the exact answer if the function is a second degree polynomial. This gives rise to a discussion about parabolas, Simpson’s Rule and a proof of their conjecture.
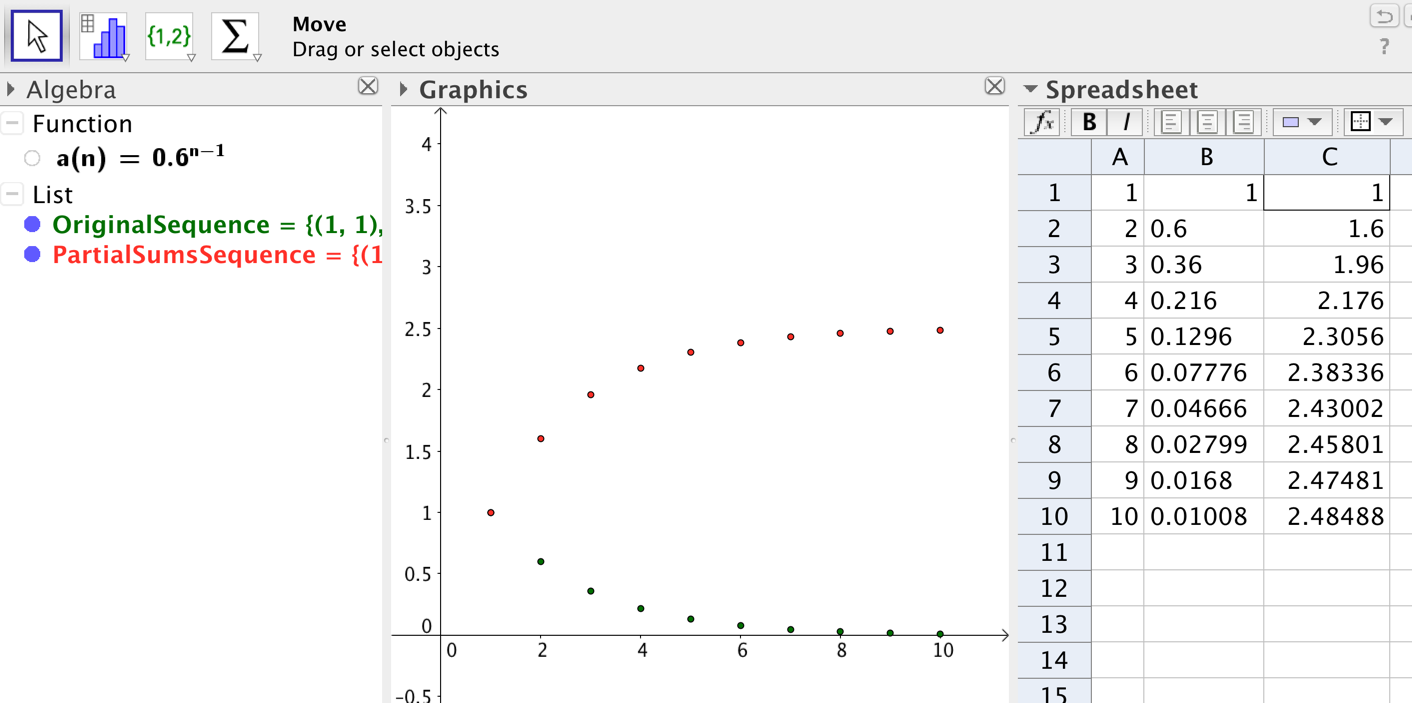
The partial sums concept is a surprisingly elusive idea for many of my Calculus II students. In the GeoGebra activity I developed for this topic, students use the spreadsheet to create the beginning terms in an original sequence and in a sequence of partial sums (see Figure 4).
Figure 4
Next they create a plot of both sequences, color code them to keep the idea of the original sequence separate from the idea of the partial sums sequence, and then make conjectures about the limiting behavior of each sequence. The activity helps students understand series at a deeper level as they proceed through the series testing topics that follow.
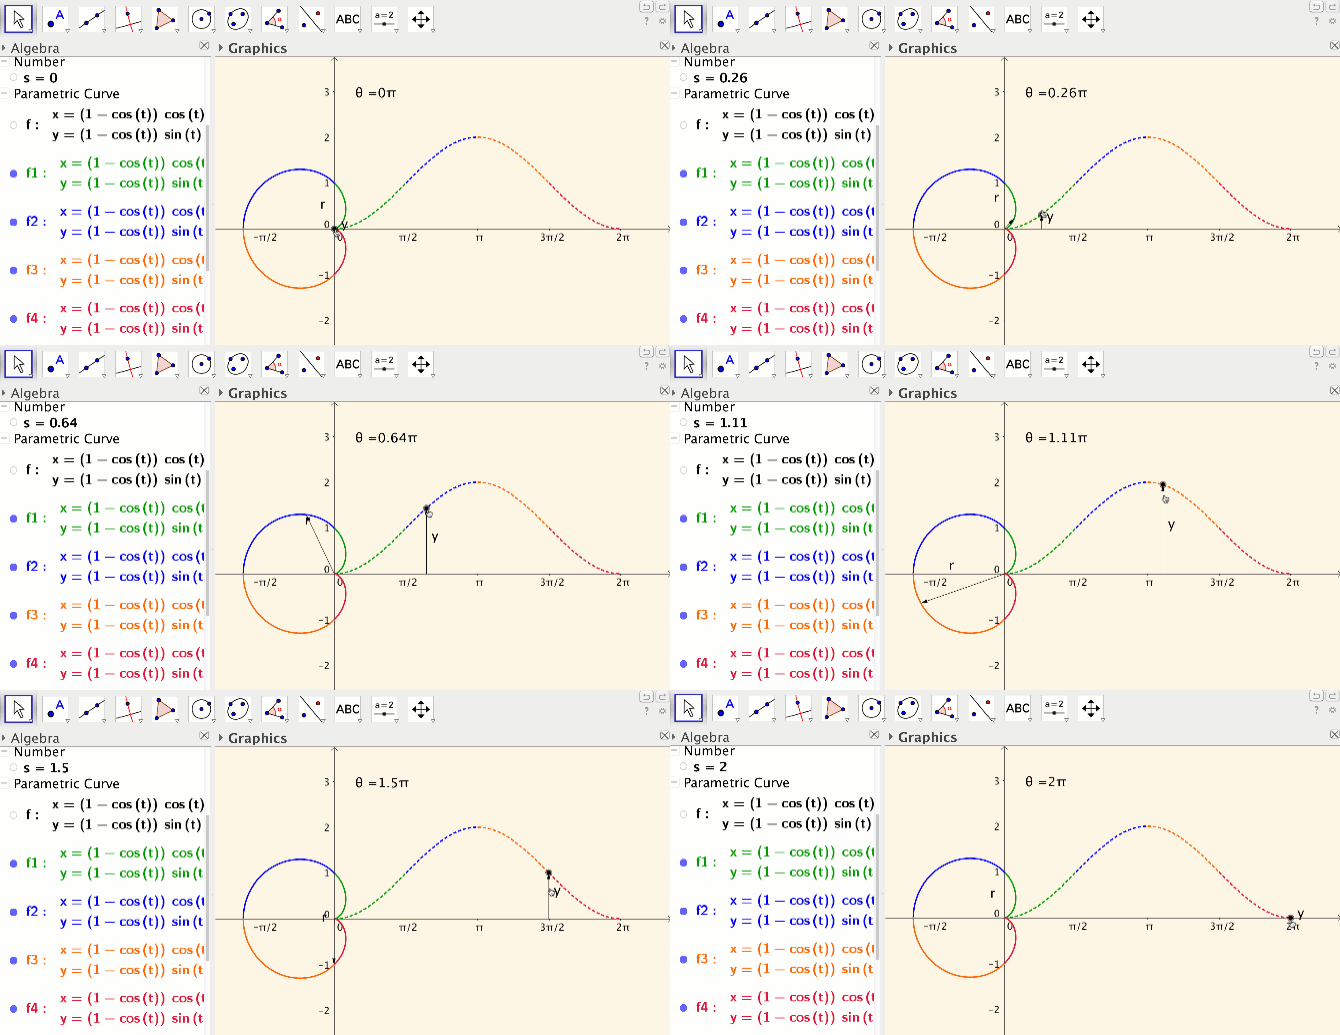
Any graphing calculator will produce the graph of a polar equation. However, by using the “Curve” command in GeoGebra students are able to see that polar equations can be thought of as parametric curves, with the angle as parameter. In the polar equation activity I designed, students use an instructor created applet to compare the so-called auxiliary Cartesian graph with the corresponding polar graph (see Figure 5). Again GeoGebra’s dynamic capability is important: a vertical vector with a point on the auxiliary curve is yoked to a radial vector with a point on the polar curve.
(Figure 5
Students explore the connection between the graph of a polar function and its auxiliary graph by varying these yoked vectors through angles between 0 and 2pi. Students move through color-coded quadrants, using the hide/show object and color–coding feature to focus on one “quadrant” at a time. Finally, students change the function to explore what happens when r < 0 in the polar graph and y > 0 in the auxiliary graph.
Through carefully designed GeoGebra activities, using both student created and instructor created applets, students gain a more rich conceptual understanding of the limit definition of the derivative; the Fundamental Theorem of Calculus; the partial sums concept; approximate integration and graphing in polar coordinates. Students begin to bridge the gap from computational fluency to deep conceptual understanding. They are actively engaged with calculus during class time. As an added benefit, I observe that when conceptual GeoGebra activities are incorporated, students enjoy calculus more than ever.
Kathy's files
If you'd like a copy of Kathy's calculus files which match her article, access the zip file here. (Ignore the 'No preview' warning.)
Two further articles promoting the virtues of student investigations are:
Comments anyone? We'd love your thoughts below!
NOTE: Create a Hyvor Talk account before commenting (click LOGIN) -that way you'll be notified of replies and you won't be anonymous.
If you don't create an account, please state your name at the start of your comment. Thanks.
NOTE: Create a Hyvor Talk account before commenting (click LOGIN) -that way you'll be notified of replies and you won't be anonymous.
If you don't create an account, please state your name at the start of your comment. Thanks.


